
- California Assembly OKs highest minimum wage in nation
- S. Korea unveils first graphic cigarette warnings
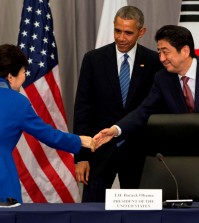
- US joins with South Korea, Japan in bid to deter North Korea
- LPGA golfer Chun In-gee finally back in action
- S. Korea won’t be top seed in final World Cup qualification round
- US men’s soccer misses 2nd straight Olympics
- US back on track in qualifying with 4-0 win over Guatemala
- High-intensity workout injuries spawn cottage industry
- CDC expands range of Zika mosquitoes into parts of Northeast
- Who knew? ‘The Walking Dead’ is helping families connect
US Korean population by the numbers


The total population, excluding those of mixed race, was 1,476,577. The average age was 38.6 years, with a ratio of 54.9 females to 46.2 males.
Here are statistics on the Korean population from new 2014 data released by the U.S. Census Bureau through American Community Survey recently.
The total population, excluding those of mixed race, was 1,476,577. The average age was 38.6 years, with a ratio of 54.9 females to 46.2 males.
By age, the breakdown was: 25 to 44 years of age, 33.5 percent; 45 to 54, 14.7 percent; 5 to 17, 13.2 percent; 55 to 64, 11.8 percent; 18 to 24, 11.1 percent; 65 to 74, 7.5 percent; 75 and over, 4.6 percent; and 5 years or under, 3.6 percent.
Over half — 55.1 percent — of the Korean population was married. Another 33.6 percent were single; 5.5 percent were divorcees; 4.6 percent were widowed; and 1.3 percent were separated.
Of the 1.06 million in population aged 25 and over, those who had not graduated high school numbered 7.2 percent; high school graduates were at 18.2 percent; those who completed 2-year colleges numbered 20.2 percent; 4-year colleges, 34.8 percent; and advanced degrees, 19.6 percent.
More than 76,400 Korean males were employed full-time and earning an average of $53,561, while 59,397 females earned an average of $45,334.
Sixty-seven percent had private health insurance, while 21.4 percent had public insurance and 16.6, none.
About 52 percent of Koreans rented homes, while 47.3 percent were home owners.
More than 414,500 were born in the United States. U.S. citizens numbered 633,478.
A majority of immigrants, 63.8 percent of them, entered the U.S. before 2000. About 24 percent arrived between 2000 to 2009, and 11.8 percent entered after 2010.
Koreas above age 5 who spoke only English at home numbered 23.8 percent, while 76.2 percent also used Korean. Almost half the population — 42.5 percent — were not sufficient in English.
Of workers, 80.2 percent of them were in the private sector. Just over 9 percent were government employees, 10 percent were self-employed, and 0.5 percent worked as unpaid housekeepers.
Related Posts


4 Comments

-
 Court dismisses ex-President Yoon’s petition against arrest
A court on Friday dismissed former President Yoon Suk...
- July 18, 2025
ENTERTAINMENT
-
 Top court upholds suspended prison term for YG founder in coercion case
The Supreme Court on Friday upheld a suspended prison...
- July 18, 2025
-
 (Movie Review) ‘Omniscient Reader’ levels up for fans, leaves newcomers lost
The upcoming action fantasy “Omniscient Reader: The Prophet” offers...
- July 18, 2025

Pingback: Average Retirement Age In Us Census Bureau | Good Times - Retirement
Pingback: Us Census Bureau Average Retirement Age | Expat Retirees
Pingback: Average Retirement Age In Us Census Bureau | A Cashed up Retirement
Gloria
December 6, 2016 at 7:14 PM
Thank you for the article. Where did you find these values? Specifically, the population breakdown by age? I am interested in finding this source.