- California Assembly OKs highest minimum wage in nation
- S. Korea unveils first graphic cigarette warnings
- US joins with South Korea, Japan in bid to deter North Korea
- LPGA golfer Chun In-gee finally back in action
- S. Korea won’t be top seed in final World Cup qualification round
- US men’s soccer misses 2nd straight Olympics
- US back on track in qualifying with 4-0 win over Guatemala
- High-intensity workout injuries spawn cottage industry
- CDC expands range of Zika mosquitoes into parts of Northeast
- Who knew? ‘The Walking Dead’ is helping families connect
The Korean community in the US: 10 years ago and now


The Korea Times survey in commemoration of its 45th anniversary in the U.S.
By Kim Chul-soo, Jung Gu-hoon
How has the perspective of the Korean community changed in the last 10 years?
The results of a survey answering those questions was released by The Korea Times today in commemoration of its 45th anniversary in the U.S.
The survey questioned 912 Koreans over age 20 in Los Angeles, New York, New Jersey, Washington D.C. and San Francisco.
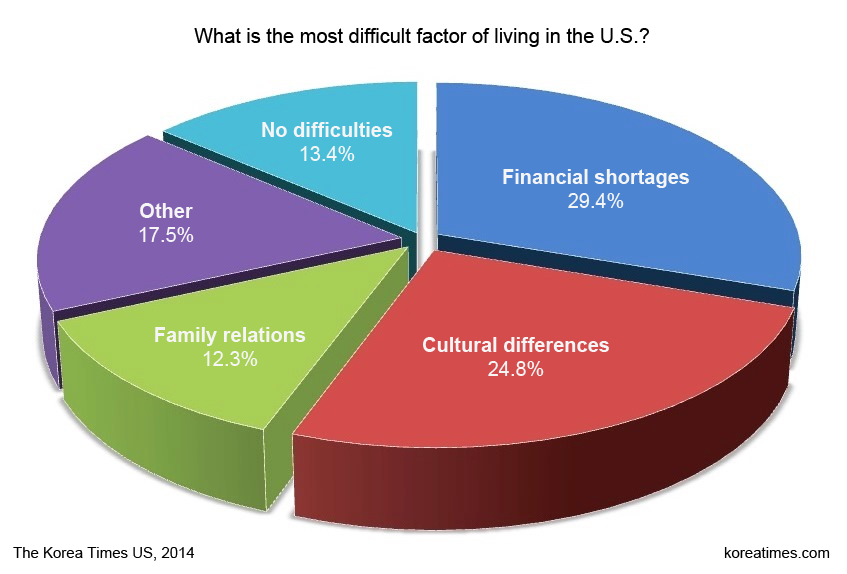
What is the most difficult factor of living in the U.S.?
According to responses, 29.4 percent said the most difficult factor of living in the U.S. is financial shortage, followed by “loneliness from cultural differences” (24.8 percent), “family relations” (12.3 percent) and “other” (17.5 percent).
“Financial shortage” also came in first 10 years ago with 26.7 percent, but the difference in the percentage who answered “no difficulties” fell from 31.1 percent to 13.4 percent during that period.
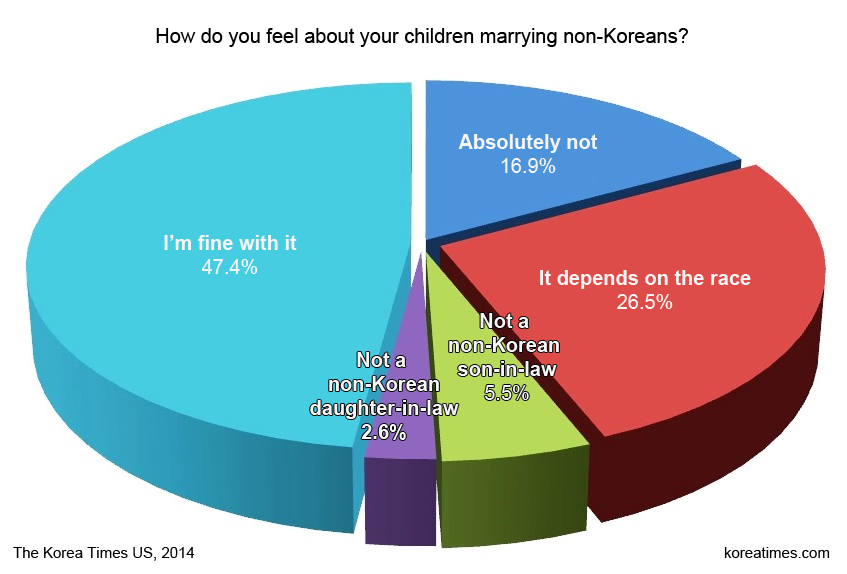
How do you feel about your children marrying non-Koreans?
While 32 percent answered “absolutely not” in 2004, the percentage decreased to 16.9 percent this year.
And while 29.7 percent said they would be fine with their children marrying non-Koreans 10 years ago, the number rose to 47.4 percent this year.
Meanwhile, 26.5 percent said it depends on the race.
Which political party do you support?
Among those surveyed, 37.9 percent supported the Democrats, 16.5 percent supported Republicans, 42.3 percent did not support either and 2.2 percent chose “other.”
The answers remained close to Koreans’ overall political preferences in 2004, when 40 percent supported Democrats, 22.2 percent Republicans, 36 percent neither and 1.8 percent “other.”
Do you own a car made by a Korean manufacturer?
The number of Koreans with Korean cars saw an increase in the last 10 years.
While Japanese cars are still the most popular with 51.9 percent, Korean-made cars took second place with 17.8 percent, followed by German cars (17.5 percent), American cars (14.3 percent) and other (8.6 percent).
In 2004, 65.8 percent of those surveyed owned Japanese cars, with American cars in second place with 23.6 percent. Korean cars came in fourth with 12.9 percent.
Which section do you read most in Korean-language newspapers?
The Korean community section was the most popular, with 31.2 percent, followed by sports and entertainment (15.8 percent), business (12.9 percent), the Korean edition (11.9 percent), education (5.6 percent), real estate (5 percent) and leisure (4.6 percent).
Local news also came out on top for most-wanted newspaper content, with 26 percent, followed by mainstream news (23.5 percent), life and health information (20.6 percent), leisure and culture (13 percent) and education (9 percent).
Related Posts


One Comment

-
 U.S. envoy, FM Cho discuss ways to build new mechanism for N.K. sanctions monitoring
The top U.S. envoy to the United Nations and...
- April 15, 2024
ENTERTAINMENT
-
 Don Lee’s ‘The Roundup: Punishment’ sets presale record for the series
The action film “The Roundup: Punishment,” starring Ma Dong-seok,...
- April 12, 2024
-
 Aespa’s Winter takes hiatus after lung surgery
Winter, a member of K-pop girl group aespa, will...
- April 12, 2024

Louis
March 19, 2016 at 7:13 AM
What I can conclude about the ‘How do you feel about your children marrying non-Koreans?’ section is that 16.9% are complete racists that should go back to Korea, 26.5% are somewhat racist, 8.1% are sexist (5.5% against men and 2.6% against women) and the remaining 47.4% are cool. So in total, 47.4% are cool with anything and the remaining 52.6% aren’t. But I’m fine with 34.6% of the people that aren’t. It’s the 16.9% that said ‘Absolutely not’ that I hate with a passion. I hope they all either change their mind or die. Either of those are fine with me.